Hopefully, if you are reading this article, it means that you’re now convinced that relative estimation is a great way to move forward. The lights are dimmed, the sunglasses are on, and the cards are ready to be dealt for your inaugural Planning Poker session. But hang on — where do you start? What does a 1-point user story actually mean? How about a 13-pointer? What is the best way to initially calibrate so that the team has a foundation to work from? If these are the questions that are running through your mind, then please read on.
An Approach
One calibration approach that some teams like to use is to identify the smallest user story in the product backlog and designate it to be the initial 1⁄2-point story (assuming they are using the Fibonacci sequence). Once this initial baseline has been confirmed, the team works its way down the list of user stories and allocates 1 point for any story that is roughly double the 1⁄2-pointer, 2 points for any story that is roughly double a 1-pointer, and so on.
This approach can certainly work, and it seems straightforward on the surface, but the reality is that it can end up taking considerably more time than you might expect. First, the team has to actually traverse through the entire product backlog to identify the starting contenders, and second, the team needs to reach a consensus as to which user story should become the actual initial baseline.
Bear in mind that your team is new to this process, so it helps to reduce as much ambiguity as possible. It is for this reason that I like to calibrate story points by utilizing work completed in the past.
Using Historical Work
The idea behind leveraging historical work is to help create mappings between known quantities (old completed work) and the new Fibonacci story point values (or whatever other scale you choose to use).
Using historical work offers a team two significant advantages: familiarity and consistency.
Familiarity
It is obvious that any team will be more familiar with work that they completed previously than with work they are going to do in the future. This familiarity proves to be particularly helpful when playing Planning Poker because instead of comparing future unknown work to other future unknown work (similar to the first approach described earlier), teams can compare future unknown work with past known work. Not only does this approach remove an element of ambiguity, but also, the speed at which these comparisons take place will be much quicker because the team can more readily recollect the historical work.
Consistency
When historical work forms the set of benchmarks (for the various point values in the Planning Poker deck), these same benchmarks can be used across any and all projects that the same team works on down the track. This early work will naturally speed up future proceedings because the initial benchmarking process is required only once (as opposed to whenever a new product backlog is formulated and presented).
Creating the Mappings
Five steps are required when creating the mappings between the historical work and the new point scale. Steps 2 and 3 in the following process are inspired by James Grenning’s article “Planning Poker Party”, which describes a similar approach (using a new product backlog rather than historical work).
Step 1: Identify
Identify a recent project that the same team (or at least most of the team) was involved in. List the discrete pieces of work, and write them on index cards (if they are in digital form). If they are not already in the user story format, they should be converted to ensure comparative consistency moving forward (see Figure 1).

Figure 1 – Transcribe any digital requirements onto index cards.
Step 2: Sort and Stack
For this next step, you need a nice, big table and the development team. Starting with the first index card, read the user story out loud and place it on the table (see Figure 2.1).

Figure 2.1 – Read the first story out loud and place it on the table.
Next, take the second card and ask the team whether they recall it taking more, less, or the same amount of effort as the first card (see Figure 2.2). If it took less effort, place it to the left of the original; if it took more effort, place it to the right; and if it took roughly the same amount of effort, stack it on top of the first. If there is any contention or confusion, “burn” the card (not literally, please).

Figure 2.2 – Read the second story and, as a group, decide whether it took more, less, or the same amount of effort as the first story.
Then take the next card and place it either to the left of both cards (if it took less effort than both), to the right of both cards (if it took more effort than both), between the cards (if its effort was somewhere in the middle), or on top of one of the cards (if it was roughly the same effort). Repeat this process for all of the index cards (see Figure 2.3).

Figure 2.3 – Read the next story and, as a group, decide where it fits in relation to all of the stories that came before it.
Step 3: Sizing Up
At this stage in the process, there should be a number of sequential card stacks (of varying sizes) on the table. Please note that I use the word stack loosely, as you can certainly have just one card in a stack in this exercise. The stack at the very left of the table will therefore contain the cards representing the smallest user stories, and the stack representing the largest stories will be located at the very right end of the table.
Now, it’s time to play some Planning Poker. Automatically assign all cards in the leftmost stack a 1-point value (see Figure 3). As an aside, I like to reserve the smallest 1⁄2-point value for trivial changes, such as label adjustments or textbox alignments, so unless your smallest stack is made up of these tiny requirements, consider starting with 1 point rather than 1⁄2 point.
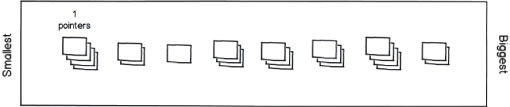
Figure 3 – With all the sorting done, the smallest stories will be on one side of the table and the largest stories will be on the other.
Starting with a representative from the second-smallest stack (directly to the right of your new 1-pointers), determine the relative effort that was required to complete it compared to a representative from the smallest stack (for example, it may be three times as much effort).
As each stack gets classified, place a card representing its relative point value above it for quick recollection, so using our example, the second stack would be tagged with a 3-pointer card.
Step 4: Subclassify
With any luck, your Planning Poker session ran smoothly (thanks to the tips that you picked up in Planning Poker at Pace, leaving you with several stacks of user stories with corresponding point values.
In a perfect world, there will be a stack that corresponds to each value in the point system that you’re using (see Figure 4.1), but do not worry if this isn’t the case. At the end of the day, so long as you have a couple of benchmark stories, you can at least get started.

Figure 4.1 – After playing Planning Poker and assigning values, you might have stacks that look like this.
If you happen to be spoiled for choice by having stacks containing a number of stories, then you can further classify them into subcategories that relate to different areas of focus (see Figure 4.2. For example, you could end up with three different 5-point stories. Even though they are grouped together (based on similar effort), they could all have very different focal points. Story 1 could have data optimization complexities, story 2 could have more of a user-interface focus, and story 3 could require integration with a third-party product. By subclassifying in this manner, the ability to compare apples to apples (when estimating new product backlogs) becomes a reality.

Figure 4.2 – You can consider subclassifying stories in the same stack by their different focal points.
Step 5: Final Filter
The final step in this calibration exercise is to filter out one representative from each stack (or substack if you subclassified as explained in step 4). These final champions will become the reference stories that are used to help start off future Planning Poker sessions (on new product backlogs). Considering that the stories have already been classified, the selection of the reference stories can be based on choosing a random story from the stack, or if you wish to be more discerning, the team can select stories that carry the most familiarity.
Keep Up Your Recycling
Although the initial calibration exercise may be complete, I recommend that you embrace and continue your new recycling practices. At the end of every subsequent project, add any completed stories to the benchmark collection to continuously build up a rich library of stories that are not only familiar but also easily relatable to a variety of different requirements.
There you have it. You are now equipped with a process to leverage historical work to calibrate some relative benchmarks. By utilizing work completed in the past, the team gains the added benefits of familiarity and consistency, making the transition to relative estimation smoother and less ambiguous.
If you liked this article, you can:
Subscribe to this RSS feed!
Find out more about relative estimation by taking one of our CSM training courses.


")


